The sar command collect, report, or save UNIX / Linux system activity information. It will save selected counters in the operating system to the /var/log/sa/sadd file. Fromlinux-logo the collected data, you get lots of information about your server:
- CPU utilization
- Memory paging and its utilization
- Network I/O, and transfer statistics
- Process creation activity
- All block devices activity
- Interrupts/sec etc.
commands explain
sar : Displays the data.
sa1 and sa2: Collect and store the data for later analysis. The sa2 shell script write a daily report in the /var/log/sa directory. The sa1 shell script collect and store binary data in the system activity daily data file.
sadc – System activity data collector. You can configure various options by modifying sa1 and sa2 scripts. They are located at the following location:
/usr/lib64/sa/sa1 (64bit) or /usr/lib/sa/sa1 (32bit) – This calls sadc to log reports to/var/log/sa/sadX format.the sar comand a a prt of this tool sysstat, to install it
Sar is apart of sysstat tool, you can install it using the following command :
yum install syssstat
Now make this modification to generate a file every 10 minutes
#vim /etc/cron.d/sysstat

*/10 * * * * root /usr/lib/sa/sa1 -I -d 1 1
# generate a daily summary of process accounting at 23:53
53 23 * * * root /usr/lib/sa/sa2 -A
# vi /etc/sysconfig/sysstat

# sysstat-10.1.5 configuration file.

# How long to keep log files (in days).
# If value is greater than 28, then log files are kept in
# multiple directories, one for each month.
HISTORY=28

# Compress (using gzip or bzip2) sa and sar files older than (in days):
COMPRESSAFTER=31

# Parameters for the system activity data collector (see sadc manual page)
# which are used for the generation of log files.
# *note
SADC_OPTIONS="-S DISK"

# *note : valid options
INT     ⇒  System Interrupts
DISK    ⇒  Block Devices
SNMP    ⇒  SNMP statistics
IPV6    ⇒  IPv6 statistics
POWER   ⇒  Power Management statistics
ALL     ⇒  All of the above
XDISK   ⇒  DISK + Partition statistics
XALL    ⇒  All of the above (ALL + XDISK)
Option Description
-u : CPU utilization statistics
-r : Memory utilization statistics
-b :I/O and transfer rate statistics
-B : Paging statistics
-d : Activity for each block device
-n : [keyword] Network statistics
-q : Queue length and load averages
-A : Display All
How Do I Generate sar Graphs Using kSar?
First, Download kSar grapher tool
you need to grab sar command statistics from the server named server1. Type the following command to get stats, run:
[server1 ]# LC_ALL=C sar -A sa08 > /tmp/sar.data.txt
[server1 ]# LC_TIME="POSIX" sar -A -f sa08 > /tmp/sar.data.txt
Switch to kSar Windows. Click on Data > Load data from text file > Select sar.data.txt from /tmp/ > Click the Open button.
Now, the graph type tree is deployed in left pane and a graph has been selected:
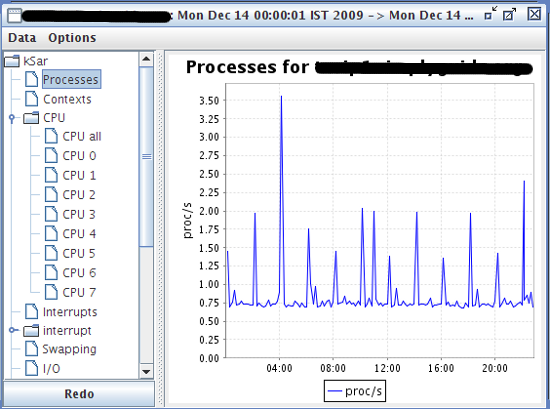
![]()